
part 50
Where was the game decided? The chance to win round by round, luck and decision, and how far to trust the number
What exactly the chance-to-win graph shows, how it is made from simulations, how a turning point splits into luck and decision, when a turning point is only noise, and whether the number can be trusted. On real games of the game and with measured numbers.
In the article on the record, the analysis and the music the analysis is one section: a button that draws, after a game, how the chance to win changed, and says whether the game was decided by luck or by decision. Here it is in detail: what the graph means, how it is made from simulations, what a turning point consists of, when a turning point is only noise, and whether the number can be trusted.
Nothing here is an illustration made up from memory: each picture is computed by the game's analysis from games that the game's tool played on 6 November 2026 (version 0.119.0), and each one says what it is made from. One limitation right away: those games were not played by a person, but by a stand-in AI in the human seat, so the numbers say something about the game and the analysis, not about people.
One answer up front, because it is in the heading: in 84 of 150 games (56 %) the analysis says the game was decided by round 3, although a game lasted a median of 20 rounds.
What the chance graph actually shows
The chance to win in the graph is not a prediction of the future, it is a measurement. At the start of each round the game saves the position (who has which tiles and how many dice) and plays the rest of the game from it many times with other dice rolls. The chance is the share of those playouts that your side won. The method is called Monte Carlo, after the casino; set the name aside and it is "try it many times and count how it turned out".
More important than the method is the exact definition, because the number is easy to misread. The chance to win in the graph is your chance if from that moment a stand-in AI of level 2 played for you (in the game, level 2 is Normal, the "average player"). The opponents play at the level the game is set to. The stand-in AI has to exist: nobody knows how a person would play, so the number is always stated for a player who plays the way it does. What follows is what the number does not say:
- It does not say how well you play. A player stronger than the stand-in AI has a higher chance, a weaker one a lower; the Analysis window says so in the line above the graph.
- It does not say what you should have played. For that there is the breakdown of turning points below.
- It is not exact. Every point is an estimate from a few playouts and has its own error (the section about noise covers that).
- The last point is not an estimate: it is the real result of the game.
Four games, four shapes
This is the graph of four real games. The headings above the curves are the words of the Analysis window in the game, which the game picks according to the shape of the curve. The band around the line is one standard error: the real chance lies in it in about two cases out of three.
Steady win (SC1): the chance is 100 % from round 3 on and stays there to the end. Comeback from 0 % (SC143): the game lasted 57 rounds, and at the points from round 5 to round 17 the chance was zero, yet the player won; out of 150 games this happened twice. Loss from 81 % (SC146): the chance stayed above a half up to round 6, then it wavered (25 %, 75 %, 31 %) and from round 11 it was zero. Duel (DUEL5): in a duel the starting player has an advantage (the article on the first move), so it starts at 100 %, and still falls to zero within five rounds.
In a long game the analysis does not have a point for every round (the panel with the comeback has a point for every fourth round). The analysis has a fixed budget of work per game, and playing the rest of a large map's game 16 times from its first round takes a long time. Of the 150 games, 67 had a sparser curve than one point per round, and a point had a median of only 8 playouts. That is why the pictures show bands of error.
The game gives each graph one of its headings. Of the 150 games (Free play with the standard settings, 4 players, a stand-in AI in the human seat):
| Headline in the game | Games |
|---|---|
| Decided in round N | 90 |
| Behind from the start | 42 |
| A steady win | 11 |
| Loss from X % in round N | 4 |
| Comeback from X % in round N | 2 |
| A game that swung back and forth | 1 |
| A close game | 0 |
The stand-in AI won 54 of the 150 games (36 %), not a quarter. In the standard settings the player starts, and the article on the first move found that the starting player of a four-player game wins 41.8 % of games; that this is the cause is an explanation, not a measurement.
When a game is decided
The game calls a game "decided in round N" when from that round on the chance stays above 90 % (for a win) or below 10 % (for a loss) until the end. For the 150 games it came out like this:
The median is round 3, with a median game length of 20 rounds. In 28 games (19 %) the chance was above 90 % or below 10 % from round 1 to the end, that is, right after the map and the dice were dealt. This is a reading, not a measurement: a game is mostly decided by the dealing and the first moves, and later rounds only finish it; close games that wave up and down to the end are the exception.
The turning point: luck and decision
When the chance changes a lot, the analysis looks for the attack that caused it and splits it up. It takes three positions: just before the attack, after its win and after its loss, and plays each of them 64 times (the game starts with 32 playouts and refines the chosen turning points). Then it says two things:
- Decision is what the attack was worth according to the chances: the average of the positions after a win and after a loss, weighted by the chance of the attack, minus the position before the attack.
- Luck is what the dice added to what the chances promised: what happened, minus that average.
Their sum is the change in the chance. Four real attacks tell four different stories; each comes from a different game, and each shows that the change alone does not say whether the attack was good:
Good decision and good luck (BAE8MR, round 7): an attack with a 72 % chance succeeded and the chance rose from 58 % to 81 % (+23): decision +16 (±7), luck +8 (±2).
Sound decision, bad luck (DUEL5, round 3): an attack with a 69 % chance failed and the chance fell from 36 % to 9 % (−27): decision −2 (±8), which is zero within the error, and luck −25 (±5). By the analysis the attack was not bad, the rolls were; this is the turning point of the duel DUEL5 from the picture with the curves (56 % → 12 %).
Decision near zero, luck (DUEL30, round 7): an attack with only a 26 % chance succeeded and the chance rose from 78 % to 89 % (+11, ±6). Almost all of it is luck, +10 (±5); the decision is +1 (±6). The game would not show this attack among its turning points (the change is 1.7 times its error, and the game wants twice that), but it is counted here by the same code. It is also an example of noise: with the first 32 playouts per position the result was "a risky decision −15 and luck +19", and with 64 playouts the decision is zero. That is why the game refines the chosen turning points to 64.
Risky decision and bad luck (DUEL39, round 2): an attack with a 70 % chance failed and the chance fell from 81 % to 53 % (−28): decision −13 (±7), luck −15 (±5). The position after a win (75 %) would have been worse than the position before the attack (81 %), so by the analysis the attack did not pay off, even if it had succeeded.
The sentence for a layman is therefore: an attack with a 69 % chance can be good and still be lost (the second line), and an attack with a 26 % chance can succeed (the third). Whoever looks only at the result mixes up luck with reason; that is why the Analysis window writes both numbers separately for each turning point. For an attack by an opponent on you there is only luck (the dice); the decision is theirs.
Five turning points in one game
Turning points are not only attacks. The game distinguishes an attack by the player or by an opponent (that one is split into luck and decision), the pressure of opponents who take your tiles, a series of attacks that move the chance together, the collapse of your largest area, a drought of reinforcements, the elimination of an opponent, and "other". The game BAE8MR, the same as in the picture in article 015, has five turning points:
Two of the turning points are attacks, and they follow each other: in round 7 an attack with a 72 % chance succeeded, and in round 8 an attack with an 88 % chance failed; the chance moved by plus and minus 23 points. In the game's sentence for the first one, luck is 8 and a good decision 16; for the second, bad luck 17 and a risky decision 7. The other three turning points are the pressure of opponents and a series of attacks, with no single attack to blame.
Paired simulations
The three positions are played with the same dice: playout number 1 has the same base of randomness for all three, playout number 2 too, and so on. When two positions differ by a single attack, the shared dice shrink the noise of their difference (statisticians call this common random numbers); the game's documentation takes that as the reason a turning point can be found reliably.
How much this helps was shown by a measurement: from 40 duels, 120 attacks were taken (the three most probable turning-point candidates from each, in the order in which the analysis looks for them), and each position was played 32 times. In 36 attacks the game was not yet decided (in the others the error is zero). The result is more modest than expected: the standard error of luck with paired playouts is a quarter smaller than with independent ones (median 0.77), but the error of the change and of the decision is the same (median 1.02). The reason is an explanation, not a measurement: when compared with the position before the attack, the playouts probably separate before the shared dice have any effect.
Noise: when a turning point is only chance
The simulation has a bad property: it says something even when it has nothing to say. In article 015 there is a story from a real game in which the analysis found a "turning point" with a change of +8 points that was only noise; from that came the rule of significance. Here it is in a picture: the same game three times, each point from 8, from 32 and from 128 playouts (always the first n of the same 128, so only the number changes).
With 8 playouts the band is wide, ±13 to ±19 points, and the line jumps. The drop between rounds 6 and 7 (the exclamation mark) looks like a turning point, −38 points, and with 128 playouts only −7 is left of it. The rule would throw it out already in the first curve: the errors of its two points (±18 and ±17) add up to ±25, so −38 is only 1.5 times the error, while the game wants at least twice that.
Of the 24 repetitions with eight playouts, the results ranged from 25 to 88 %; with 128 playouts, from 50 to 61 %. The spread (standard deviation) fell from 15.2 points to 2.8. The error the game reports is a bit larger than the actual spread (18.0 and 4.4 points): a small value is added to the formula, so that a point where all playouts ended the same way does not claim to be exact.
From this come three rules. They are numbers in the game's data, not logic: a turning point must have a change at least twice its own standard error (and at least 8 points; if there are too few turning points, 5 is enough), there are at most five turning points, and luck or decision is named in words only when it has at least 3 points and 1.5 times its own error. The error is bigger than one would expect: in the 150 games a point had a median of 8 playouts and a standard error of ±7 points on average, and in the middle of the graph (chance 20 to 80 %, 215 points) ±12 points.
Can it be trusted?
Looking at a graph and trusting it is cheap. That is why the analysis was calibrated: many games are taken, for each estimate the predicted chance is recorded, and after the game ends it is compared with the real result. It is like a weather forecast: when it says 30 % rain, it should rain on about a third of such days.
Two tools serve this. The reliability diagram groups the predictions into ten bands (0 to 10 %, 10 to 20 %, …) and for each shows the real share of wins; if the points lie on the diagonal, the prediction fits. The Brier score is the mean of the squared differences between the prediction and the result (0 for a loss, 1 for a win): 0 is perfect, 0.25 is constant guessing at 50 %, and lower is better.
The game measured its Brier score on 20 October 2026: 0.0452 on 210 games (1,887 estimates; a constant 50 % guess gives 0.2500), and 0.0431 on an independent sample. Today both were repeated on game 0.119.0: 0.0456 and 0.0442. The numbers of estimates changed a little (1,839 and 1,810 instead of 1,887 and 1,814), so something in the game changed after 20 October that affects the AI; what exactly was not investigated. A completely new sample of 210 games (seed ART50) gave 0.0499: the same order of magnitude, but 10 to 16 % worse than the earlier results. This is not presented as a deterioration until it is measured on more samples; the third decimal of the Brier score varies between samples. The average prediction matches the average result (51 % and 51 %; in the other samples 47 % and 46 %), so the analysis is not biased to one side.
The two largest groups, 0 to 10 % and 90 to 100 % (three quarters of the estimates), match to a percent or two in all samples. The middle groups have only 30 to 58 estimates and an error of 6 to 9 points, so deviations are expected there. The group 80 to 90 % is today below the prediction in two independent samples (71 % and 68 % at 84 %) and above it in the repeated first one (95 %); together 77 % at a prediction of 84 % (±4): about two errors below. That is not enough for a conclusion, but it is worth watching.
What calibration does not say. In this measurement the stand-in AI that plays the playouts also plays the human's seat, so what is checked is whether the simulation predicts correctly a game that the AI would play itself. It does not test whether the analysis is true about people; there is no data for that, and so the game shows a sentence above the graph saying that the number is about the value of the position, not about how well you play.
Speed and the same answer
The graph is computed in a Worker (a background thread, so the page does not freeze) in 0.6 to 1.4 s; on a processor four times slower, without a Worker (a phone), it took 3.3 to 6.1 s (measurements of the game from 20 October in Chromium, with real input). Today the coarse graphs of 150 games were computed in Node with a limit of 200 % of the processor on a loaded machine: median 2.0 s, at most 4.1 s. It is a different machine and a different measurement, and the order of magnitude has not changed.
More important is that the same record always gives the same graph. The number of playouts per point is set by the work a playout costs, not by the clock, so the same numbers come out in the Worker, in the main thread and on a slow machine (a test of the game checks this even with a different splitting of the work). Checked on the game BAE8MR: two separate runs of node tools/realms/kastgard/games/stacks/analysis.js --record BAE8MR.json --json gave an output that was identical byte for byte (1,797 playouts), and the same as the one for the picture in article 015.
Where to find it in the game
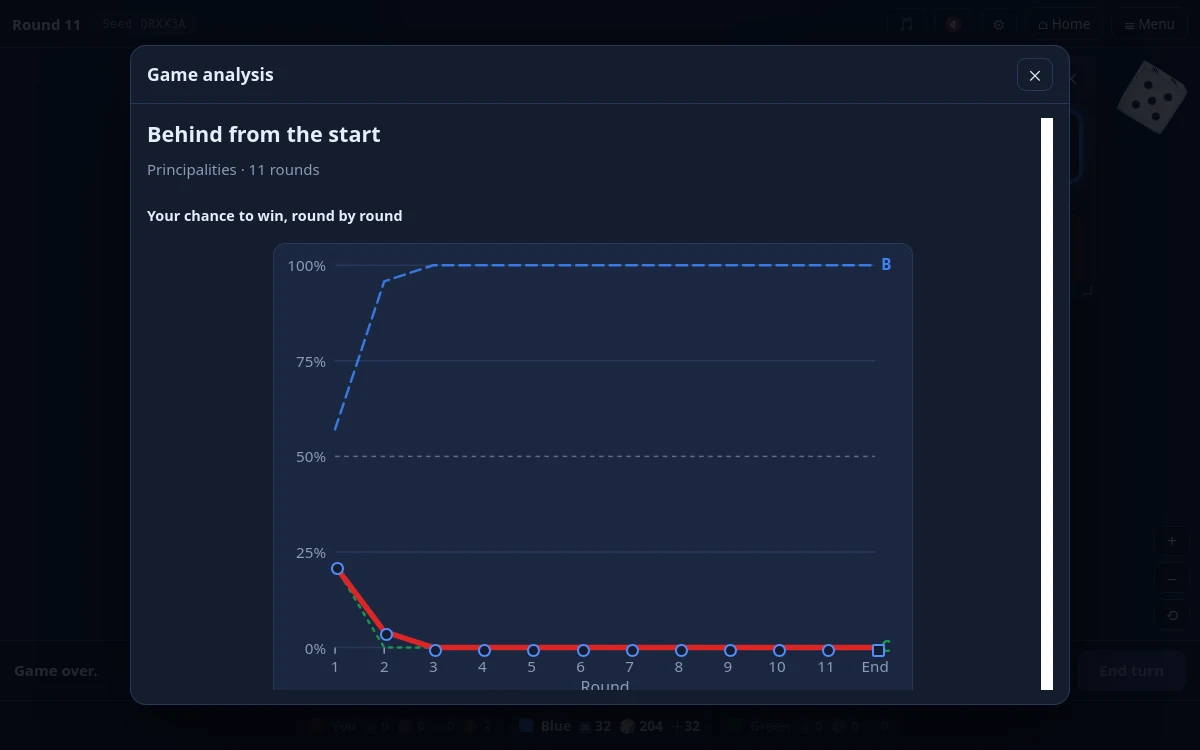
The Analysis button is on the end-of-game card, in the list of records (statistics, the Records tab) and in the record player. The analysis is everywhere there is a record, that is, in the Principalities, the Tribes, Free play and the daily challenge (missions and minigames have no record). The narrator (the Avatar) offers the analysis after a lost game. The points on the graph are buttons: Enter on a point opens the record player at exactly that moment.
What to take from it
- The number is only as good as its definition. "The chance to win" is the chance a stand-in AI would have to win; it speaks of the value of a position, not of the player.
- Every estimate comes with an error. A point from 8 playouts can differ from a point from 128 by tens of points; without a band of error, one would read from the graph stories that are not there.
- A change in chance is not the quality of a decision. A bad attack can succeed and a good one fail; that is why a turning point is split into luck and decision.
- The rule of significance matters more than more simulations. A turning point that is not at least twice its error is not named.
- Check even what the documentation says. Paired simulations help with luck by a quarter and do not help with the change and the decision; calibration came out a little differently today than on 20 October.
- Calibration makes the graph a measurement, but only about the AI. It confirms that the simulation predicts a game that the AI itself would play.
Sources and notes
- The game and the games: version 0.119.0, data from 6 November 2026. The game was only read; the games were played by its tool, with a stand-in AI of level 2 in the human seat. The series
SC<n>is Free play with the standard settings, the seriesDUEL<n>the same with one opponent. The pictures stay as they were on 6 November 2026. - From the documentation: the game's
docs/DESIGN.md, §34, anddocs/TUNING.md, §26, state of 20 October 2026. The numbers of the rules (twice the error, 8 and 5 points, 90 % and 10 %) are in the analysis data of the game. - Worked out: the breakdowns of attacks, the turning points, the noise and the calibration are measurements from these games and from one-off scripts that are not part of the game.
- Not verified: whether the analysis is true about people (the calibration covers only the stand-in AI), and whether the Brier score 0.0499 of the new sample is chance or a small deterioration.