
part 57
Statistics during a game: what the window counts and how luck is calculated
What the Statistics window counts during a game, and how the Luck column is made from attacks: wins minus the expected wins by the odds of each attack. One attack step by step, a real game by turns and 2,000 simulated games.
In the article on the menu, the windows and the saved state, Statistics is a button in the menu and a window that can be pinned to the top left. What the window counts, and where the number in the Luck column comes from, is not there. This article fills that in. The article on the analysis measures luck and the decision after a game, in the chance to win the whole game; the Statistics window counts it during the game and in the wins of single attacks. It is the same idea under another name, and the luck table in the Analysis takes exactly the same counters from the game.
The state is Audamir 0.124.1 (7 November 2026), the Principalities mode. The numbers come from the code of the game, from its documentation and from runs of the tools of the game; the game was only read. The commands are in the sources at the end. What is an explanation and not a measurement is marked as such.
Three answers in advance:
- Luck is the sum over the player's attacks: won attacks minus expected wins. Each attack has a chance p before the roll. If it succeeded, the player gets 1 − p; if not, −p.
- On average it is zero. In 2,000 simulated games of four equal AIs the average luck was +0.005 wins per player (±0.024), and the spread of the numbers (2.15) matched the one predicted by the chances of the attacks themselves (2.12).
- Zero on average does not mean zero in the game. A typical player ends a game with luck around ±2 wins, and the winner in these games had +0.77 on average, the others −0.25. The number does not say whether the move was good.
What the window shows
The window opens with the Statistics button in the menu ☰ or with the key S, and after the end of a game with the button on the end card. It has three tabs: Overview, Chart and Log.
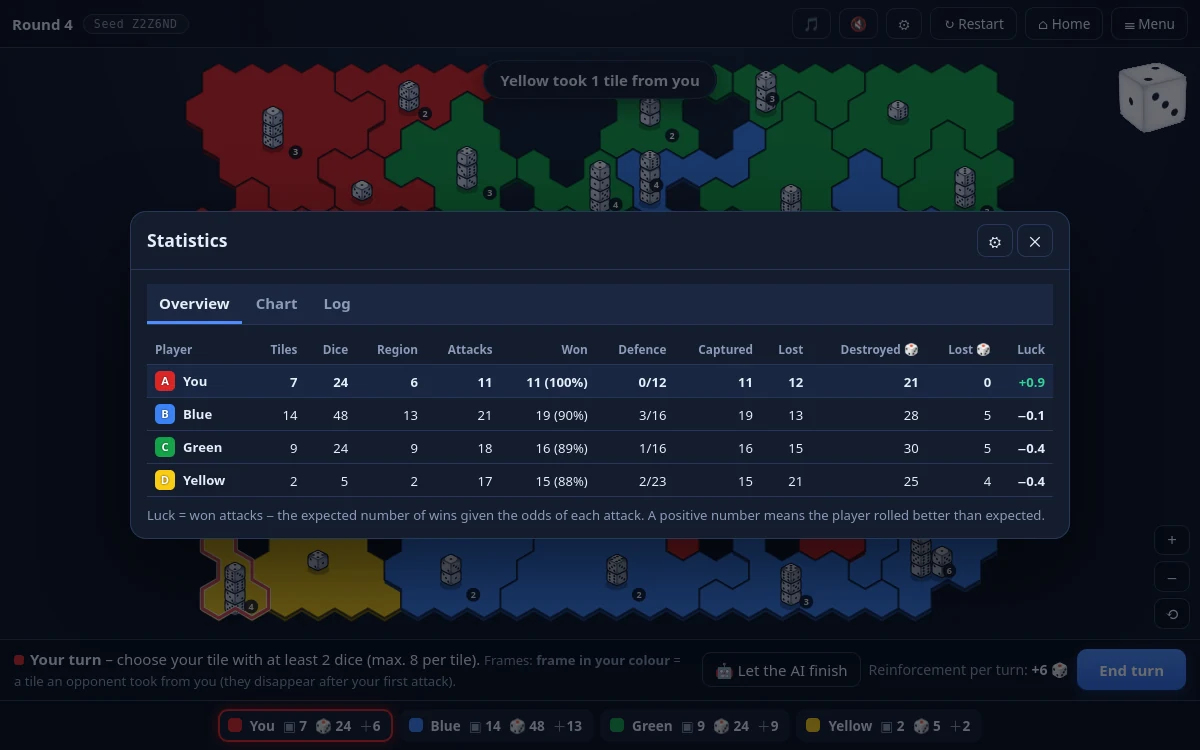
Overview is a table with a row for each player in the order of places (the row of the human is highlighted, an eliminated player is faded) and eleven columns. The names come from the catalogue of the game; the explanations appear when the mouse is over the header:
| Column | What it counts | Where it comes from |
|---|---|---|
| Tiles | number of tiles | counted from the map at each drawing |
| Dice | number of dice on the map | from the map |
| Area | the largest connected area, the basis of reinforcements per move | from the map |
| Attacks | number of attacks made | counter |
| Won | won attacks and their share, for example “55 (95 %)” | counter |
| Defence | successful defences / number of attacks on the player, for example “3/34” | counters of the defender |
| Conquered | tiles conquered | counter |
| Lost | tiles lost | counter |
| Destroyed 🎲 | the defender's dice that stood on the tile when a successful attack happened | counter |
| Lost 🎲 | own dice lost in an attack that failed | counter |
| Luck | won attacks minus the expected number of wins | counter of wins and sum of the odds |
The three columns about the map are read from the state of the game, so they always match what is on the board. The others are counters that the game keeps in game.stats and adds to after every resolved attack: Engine.resolveAttack calls Stats.recordAttack right after the result of the roll is carried over to the map. An open window refreshes during the game at most every 350 ms. The counters are saved together with the game in progress, so after a continuation they do not start from zero. The game keeps two more that the window shows nowhere: the dice the player got from reinforcements, and the largest stack he attacked with.
This is how the window looks in a game under way (round 4, four players; the AI played the game also in the seat of the human; game 0.124.1, 7 Nov 2026). Green is at −2.4 in the picture, that is 2.4 wins worse than the odds promised (red number), Yellow at +1.3 (green number), and the note under the table says the same in words:
And this is the Overview at the end of one real game. It is a game of the Principalities for four players (game number CLS4, 12 rounds, 140 attacks), the same as in the articles on the piece of music from one game and on the picture of one game. In the seat of the player “You” a stand-in AI of level 3 played, not a human; the opponents are AI of level 2. The numbers are from the same counters that the window reads (Stats.rows):
| Player | Tiles | Dice | Area | Attacks | Won | Defence | Conquered | Lost | Destroyed 🎲 | Lost 🎲 | Luck |
|---|---|---|---|---|---|---|---|---|---|---|---|
| You | 32 | 188 | 32 | 58 | 55 (95 %) | 3/34 | 55 | 31 | 145 | 13 | +2.7 |
| Blue | 0 | 0 | 0 | 45 | 41 (91 %) | 6/55 | 41 | 49 | 85 | 13 | −0.3 |
| Green | 0 | 0 | 0 | 22 | 20 (91 %) | 2/30 | 20 | 28 | 35 | 5 | +0.9 |
| Yellow | 0 | 0 | 0 | 15 | 13 (87 %) | 0/21 | 13 | 21 | 17 | 4 | −0.8 |
You won by conquering the whole map (32 tiles); the others have zeros in the first three columns, because they were eliminated. The numbers can be checked against each other: the conquered tiles add up to 55 + 41 + 20 + 13 = 129 and the lost ones 31 + 49 + 28 + 21 = 129; the attacks received add up to 34 + 55 + 30 + 21 = 140, which is also the number of attacks; of them 129 succeeded and 11 were defended (3 + 6 + 2 + 0).
Chart is a line chart of one of three quantities, Tiles, Dice or Largest area, by rounds, with a line for each player (the lines can be switched off in the legend). The points are written at the end of each round (Stats.snapshot) and the last point is live. Luck is not in the chart: the history keeps only the tiles, the dice, the largest area and the reserve of reinforcements.
Log is a list of events, the newest first: the round, who attacked whom, the number of dice on both sides, the sums of the rolls, the result (“conquered” or “failed”), reinforcements and eliminations. It can be filtered to All and Only mine. The window shows the last 1,000 records; the game keeps at most 2,000.
Two kinds of window
Statistics is either a window that covers the game and always has all the columns, or a window pinned above the board (the cog in the header): it floats over the map, the game is played beside it, and it needs a screen at least 700 px wide. Only in the pinned window can the columns be chosen; the ready choices are All columns, Short overview (Tiles, Dice, Area) and Only luck (the only column Luck). The Statistics at the end of a game always have all the columns and have no cog (DESIGN §21.5 and §30.5). Under the table there is a note “Luck = won attacks − expected number of wins according to the odds of the single attacks” while the column is on. With the setting Fog of war, the player sees a question mark instead of the dice, area and luck of the opponents until the game ends.
How luck is calculated
The definition is in one sentence and also in the code: at every attack the game remembers what chance of winning the attack had before the roll, and adds the chances up. Luck is the difference between how many attacks succeeded and that sum.
expected wins = sum of the chances p of all the player's attacks
luck          = won attacks − expected wins
contribution of an attack = 1 − p if it succeeded;  −p if it did not
The entry is in Stats.recordAttack: A.expected += roll.p, and on a win A.wins++. The number roll.p is computed by rollAttack before the roll from the dice on both tiles. The window then shows wins − expected with one decimal and a sign; from +0.5 the number is green, from −0.5 red.
The chance of an attack
The attacker rolls as many dice as he has on the tile, the defender as many as he has on the attacked tile. The one with the higher sum wins. On a tie the setting Tie in the roll decides: by default Defender wins (the original rule), otherwise Attacker wins or Roll again. The defence bonus is added to the defender's sum if the setting or the fortress gives it (a fortress gives 3 points); the chances take it into account. The function winChance in rules.js builds the distribution of the sum over the dice (each further die moves every sum by 1 to 6, each with a sixth), and the chance of the attack is the sum over all sums s the attacker can roll: the chance that he rolls it, times the chance that the defender (with the bonus) rolls less.
Rules.winChance of Audamir 0.124.1 (7 Nov 2026) with the default rules: a tie goes to the defender, the defence has no bonus. Each value was checked by a listing of all rolls (33 pairs, the difference only in rounding). Equal numbers of dice are shaded.The table shows that the same number of dice is not enough: 1 against 1 wins 41.7 % of attacks and 8 against 8 only 47.1 %, because a tie goes to the defender. Double the dice is a decision in small columns (2 against 1: 83.8 %), a certainty in big ones (4 against 2: 93.9 %, 8 against 4: 99.0 %). One die more matters less and less as the column grows: 3 against 2 has 77.9 %, 5 against 4 71.8 % and 8 against 7 67.3 %. And an attack of four dice on one succeeds in 99.7 %, one die on four in 0.1 %.
One attack step by step
The example is from the real game CLS4: attack no. 30 of 140, in round 1 Yellow attacks with three dice a tile with two. What happens:
- The chance before the roll. The game calls
winChance(3, 2, 0, 'defender')and gets 0.7785. The picture shows it step by step: the attacker can roll a sum from 3 to 18 and each sum has its chance (column); the dark part is where the two dice of the defender give less. Five dice can be rolled in 6⁵ = 7,776 ways and in 6,054 of them the attacker wins. 6,054 / 7,776 = 0.7785. The listing of all 7,776 rolls gave the same, not only the formula. - The roll. The attacker rolled 8, the defender rolled 8.
- The result. The sums are equal, the tie goes to the defender, the attack failed. The player is credited 0 − 0.7785 = −0.7785.
- What would have happened had it succeeded. It would have been credited 1 − 0.7785 = +0.2215.
- The average. With probability 0.7785 comes +0.2215 and with 0.2215 comes −0.7785: 0.7785 · 0.2215 − 0.2215 · 0.7785 = 0. The attack therefore on average adds nothing and takes nothing away.
Rules.winChance and from the listing of all rolls. The sum 8 is the one that fell in the game.This is how every line of the number arises. The whole number in the window for Yellow is his 15 attacks of the whole game: 13 succeeded, 2 did not. The table lists them with what the game saw (rounds 1 to 3, then Yellow was eliminated):
| Round | Dice | Chance | Sums | Result | Contribution | Sum |
|---|---|---|---|---|---|---|
| 1 | 5 against 2 | 98.8 % | 19 : 5 | succeeded | +0.012 | +0.012 |
| 1 | 4 against 1 | 99.7 % | 18 : 5 | succeeded | +0.003 | +0.015 |
| 1 | 4 against 1 | 99.7 % | 23 : 2 | succeeded | +0.003 | +0.017 |
| 1 | 4 against 2 | 93.9 % | 10 : 7 | succeeded | +0.061 | +0.078 |
| 1 | 3 against 1 | 97.3 % | 10 : 2 | succeeded | +0.027 | +0.105 |
| 1 | 3 against 1 | 97.3 % | 8 : 2 | succeeded | +0.027 | +0.132 |
| 1 | 3 against 2 | 77.9 % | 8 : 8 | failed | −0.779 | −0.646 |
| 2 | 4 against 1 | 99.7 % | 18 : 5 | succeeded | +0.003 | −0.644 |
| 2 | 4 against 1 | 99.7 % | 9 : 5 | succeeded | +0.003 | −0.641 |
| 2 | 3 against 1 | 97.3 % | 17 : 1 | succeeded | +0.027 | −0.614 |
| 2 | 3 against 2 | 77.9 % | 9 : 8 | succeeded | +0.221 | −0.392 |
| 2 | 3 against 2 | 77.9 % | 14 : 7 | succeeded | +0.221 | −0.171 |
| 2 | 2 against 1 | 83.8 % | 7 : 6 | succeeded | +0.162 | −0.009 |
| 3 | 4 against 1 | 99.7 % | 11 : 2 | succeeded | +0.003 | −0.006 |
| 3 | 3 against 2 | 77.9 % | 10 : 10 | failed | −0.779 | −0.785 |
The sum is computed from unrounded values, so it need not equal exactly the sum of the rounded contributions. Thirteen wins gave +0.772 together and two losses −1.557; altogether −0.785, in the window −0.8, in red. Expected wins were 13.785 and 13 came. What is interesting is what this number is paid for: both losses are ties (8 : 8 and 10 : 10), which go to the defender under the default rule. And this is not an exception of this game: of the 11 failed attacks of the whole game, 6 were ties.
Why this is a fair measure
Luck is measured against the chance of the same attack. An attack with a chance of 26 % is +0.74 when it wins and −0.26 when it loses; an attack with a chance of 97 % is +0.03 when it wins and −0.97 when it loses. A player who takes risks is therefore neither penalised nor rewarded: each of these attacks has zero on average, so the sum has it too. The number thus measures neither courage nor strength, only by how much the dice added to or took away from what the odds promised.
Checked in the game
Chances: the function against the listing of rolls
For every pair of 1 to 6 dice against 1 to 6 dice whose total number of dice does not exceed ten (33 pairs, at most 6¹⁰ = 60 million rolls per pair), all the rolls were listed and counted in how many the attacker wins. The result differs from the function of the game by at most 3 · 10⁻¹⁶, that is by rounding. The table for 1 to 8 dice is from the function of the game; all 140 attacks of the game CLS4 have at most 8 dice on each side, so their chances are from the table; they agree with those the game wrote down at the attacks, to four decimal places.
Simulation: 2,000 games of four equal AIs
The average luck can be measured only over many games. The game has a tool that plays a whole game without waiting (Engine.playGame); the same tool is used by the measurement of the fairness of the order of turns. Here 2,000 games were played on the middle map (four players, seeds STAT0 to STAT1999), all four are AI of the same level 2. As in the fairness tool, the game does not end with the elimination of the player in the seat of the human, but only when a single living player is left, so that all the seats are on the same footing. After each game, Stats.rows(game)[i].luck is read for each player, that is the number the window would show. The only thing the script added is a copy of the write of the attack, which also adds p · (1 − p) for each attack to a sum: that is the variance the numbers should have if the model in the article holds.
| Measurement | Value |
|---|---|
| Games, players in the games | 2,000, 8,000 |
| Average luck | +0.005 (±0.024) |
| By place at the table (1st to 4th) | −0.034, +0.009, +0.089, −0.043 (each ±0.04 to 0.05) |
| Standard deviation, measured | 2.15 |
| Standard deviation predicted by the odds | 2.12 |
| Attacks per player in a game, average chance of an attack | 64.6; 91.3 % |
| Wins in total and expected in total | 471,982; 471,941.4 of 516,807 attacks |
| Player in a game outside ±2 wins | 32.3 %, outside ±4: 6.9 % |
| Worst, best luck | −11.4; +10.2 |
What follows from this:
- The average is zero within the error, also for each place separately (each is at most 1.9 errors from zero). There were 41 wins more than expected out of 516,807 attacks, that is by eight hundred-thousandths.
- The measured deviation agrees with the predicted one (2.15 against 2.12). That is firmer proof than the average: it means that the numbers the window counts behave exactly as the model describes them, even though the AI chooses attacks by the state of the game.
- Luck around ±2 wins is common per game. Outside ±2 almost a third of the players ended. The window colours the number green from +0.5 and red from −0.5: in these games the green number was at 40.0 % of players, the red at 39.5 % and without colour at 20.5 %. The voice of the Avatar (described in article 053) speaks about the luck of the player in the seat of the human from ±1.6 after at least six attacks; a value of ±1.6 or more was at the end of the game at 41.6 % of players.
- The AI level changes the spread, not the average. AI of level 3 (1,000 games, the same seeds as the first thousand) attacks less, on average 42.8 times per game against 64.6, and the spread is smaller: +0.042 (±0.027), measured deviation 1.73 and predicted 1.75. The average chance of an attack is 90.3 %.
Of the 2,000 games, 1,993 ended with the conquest of the whole map and seven got stuck in a stalemate and ended on points; the games had 14.8 rounds on average, the longest 42.
One real game by rounds
The simulation talks about the average, a game is played once. The picture shows the luck of the four players of the game CLS4 after every round, read from the counters of the game after every attack. The line of You (red, thick) rises to +2.1 by round 3, then wavers between +1.5 and +3.1 and falls by 0.5 in the last round: an attack of five dice on three with a chance of 91 % failed on a tie, 12 : 12. Yellow (eliminated in round 4) and Green (in round 5) do not attack from round 4 on, so their lines are flat. Blue drops from +0.6 to −1.0 in rounds 7 and 8: in each of these rounds one of its attacks failed, with a chance of 88 % and 94 %. Then the line rises a little again.
Stats.rows) after every attack, not from the text of the window. Game 0.124.1, 7 Nov 2026.The final numbers are those of the Overview table above. The game analysis (article 050) shows for the same game a table of Attacks, Wins, Expected and Luck with the same counters, only to two decimal places: You 58, 55, 52.33, +2.67; Blue 45, 41, 41.34, −0.34; Green 22, 20, 19.05, +0.95; Yellow 15, 13, 13.78, −0.78 (the analysis run over the record of that game, 4 s).
To read the number it has to be compared with its deviation. From the odds of the 58 attacks of You the predicted deviation is worked out as 2.12, so +2.7 is 1.3 deviations: better than the average, but common. In the simulation +2.7 or more was reached by 9.8 % of players (every tenth). Yellow has a predicted deviation of 0.99 from his 15 attacks, and −0.8 is 0.8 deviations; such or worse luck was had by 34.3 % of players.
What the number does not say
It does not say whether the move was good. An attack with a chance of 26 % may succeed and an attack with a chance of 97 % may fail. Luck is credited to how the rolls fell, not to whether the attack paid off. Whether it paid off is distinguished by the analysis of the game: its turning points are split into luck and decision in the chance of winning the whole game. The window speaks here only about the rolls.
It is credited only to the attacker. A defence that holds against an attack with a 91 % chance appears in the table only as a minus of the attacker; the defender gets nothing. The sum of luck of the four players therefore is not zero in the game: in the simulation it came out at +0.02 on average, but with a deviation of 4.26. The bad luck of an opponent appears nowhere in your number.
The average zero holds for all players together, not for the winner. The winner had luck on average +0.77 (±0.06) in the 2,000 games, the others −0.25 (±0.03). The luckiest of the four players won 45.0 % of games and the least lucky 17.8 %, while 25 % would be won by any of the four equally strong players if luck meant nothing.
The measurement cannot say what is the cause and what the effect. An explanation (not a measurement): a player whose two attacks with a high chance fail loses columns of dice, and with them further attacks and tiles, and so loses more often; on the other hand a player who wins attacks for longer, and his luck lines get longer. Summed over all players the average stays zero, but the winner and the loser fall into different halves.
It does not count reinforcements or bonuses. Reinforcements are distributed at random or placed by the player himself, but they do not enter luck (the counter gained stays out of the sum). Attacks on neutral tiles are counted like the others.
The reroll bonus shifts the number (from reading the code, not measured). Engine.resolveAttack gets only the last roll of an attack and writes its chance; a failed roll that was repeated is not written at all. For an attack with chance p and one repeat, the chance of winning is p + (1 − p) · p, which is more than the written p, so in games with this bonus (according to DESIGN it is the campaign) luck has an expectation above zero. In the standard games and in the simulation there is no bonus.
What I take from it
- Luck is the difference between the attacks won and the sum of the chances of those same attacks. Each attack adds 1 − p or −p and on average zero; the number measures rolls, not moves.
- The number can be checked. The chances agree with the listing of all rolls, and the measured deviation 2.15 agrees with the prediction 2.12, so the window counts what it says.
- Typical luck per game is around ±2 wins. Almost a third of the players are outside ±2, and +2.7 after 58 attacks is 1.3 deviations, nothing exceptional.
- The winner tends to be luckier, but that is no proof that luck decides. The luckiest of the four won 45 % of games, the least lucky 17.8 %; cause and effect cannot be told apart from this.
- Decisions are judged by something else. The window measures the rolls in attacks; where the game was decided is told by the analysis in article 050.
Sources and notes
- State and method: Audamir 0.124.1 (7 Nov 2026), the Principalities mode. The game was only read; the tools ran over a copy of the tree (
git archive) underulimit -v(6 GB). - Picture of the window: scene
statsintools/video-teaser/shots.js(--lang sk,en), headless Firefox; a game differs in every run, so the numbers in the picture are not those of game CLS4. - Game CLS4:
audamir-056-game.js(gameprincipalities4, seed CLS4; the record was replayed byReplay.runand after every attackStats.rowswas read), table of the Analysisaudamir-056-analysis-luck.js. - Chances and simulation:
audamir-056-odds.js(Rules.winChance, listing of all rolls),audamir-056-sim.js(2,000 games of level 2, 1,000 of level 3), processingaudamir-056-build-data.js→tools/charts-data/statistiky.json. - Code:
js/ui/panels.js,js/realms/kastgard/games/stacks/core/stats.js,rules.js;docs/DESIGN.md§21.5, §30.5, §121. - Not measured: luck in games with campaign bonuses, in team games, with fog of war and with other tie rules; how the window looks on a phone.